There are various methods available to analyze and optimize funnel conversions. By leveraging data visualization tools such as Tableau, Domo, Microsoft Power BI, or Google Studio, I have discovered numerous opportunities to enhance conversion rates.
In this article, I will share dynamic dashboards created in Google Studio, using Google Analytics data from an e-commerce website. The first example features bottom-funnel conversion steps with three control panels that allow data filtering by device type, browser, and geographic location. This visualization serves as an excellent starting point to uncover UX design opportunities and enhance the overall customer experience by focusing on content structure, competitive analysis, and customer analysis.
Conversion Funnel on CheckOut/Booking Engine
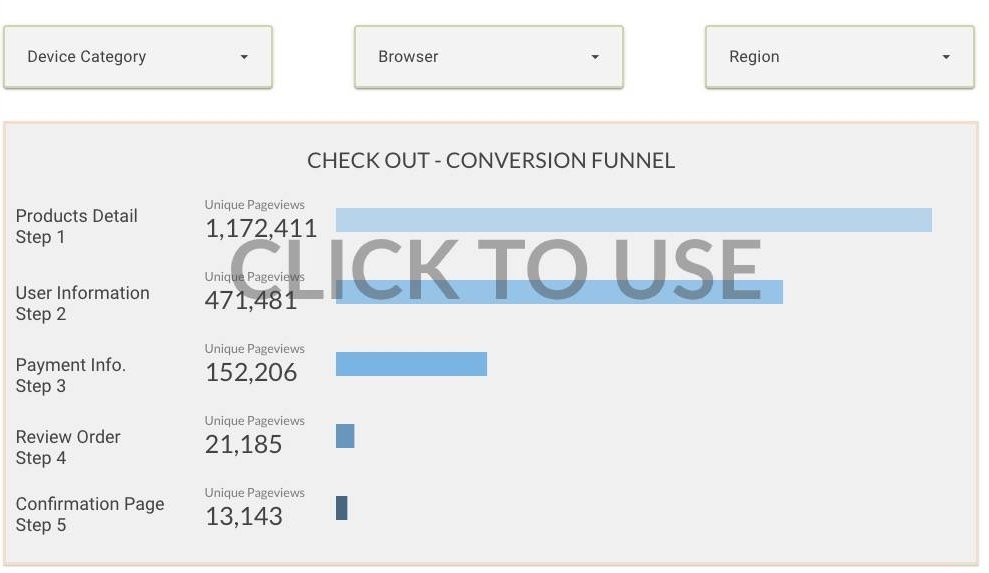
For instance, we observe a significant exit rate in stage 3, where users are required to input their personal information. This pattern may be influenced by several variables that need to be identified and addressed.
Here are some questions we can formulate for this step:
- Are we asking for the correct information comprehensively?
- Can we improve content elements like “buttons, mandatory fields, etc.”?
- Are we displaying the correct errors when users mistype information into specific fields?
- Should we merge step 3 with step 4 to simplify the conversion flow?
Once we have formulated our hypotheses, we can leverage optimization and testing tools like VWO or Optimizely to conduct A/B or multivariable tests, leading to statistically significant conclusions. Funnel conversion dashboards provide valuable guidance to our marketing team in identifying the most urgent fixes within the conversion funnel stages.
Landing Pages and Check Out Funnel Optimization
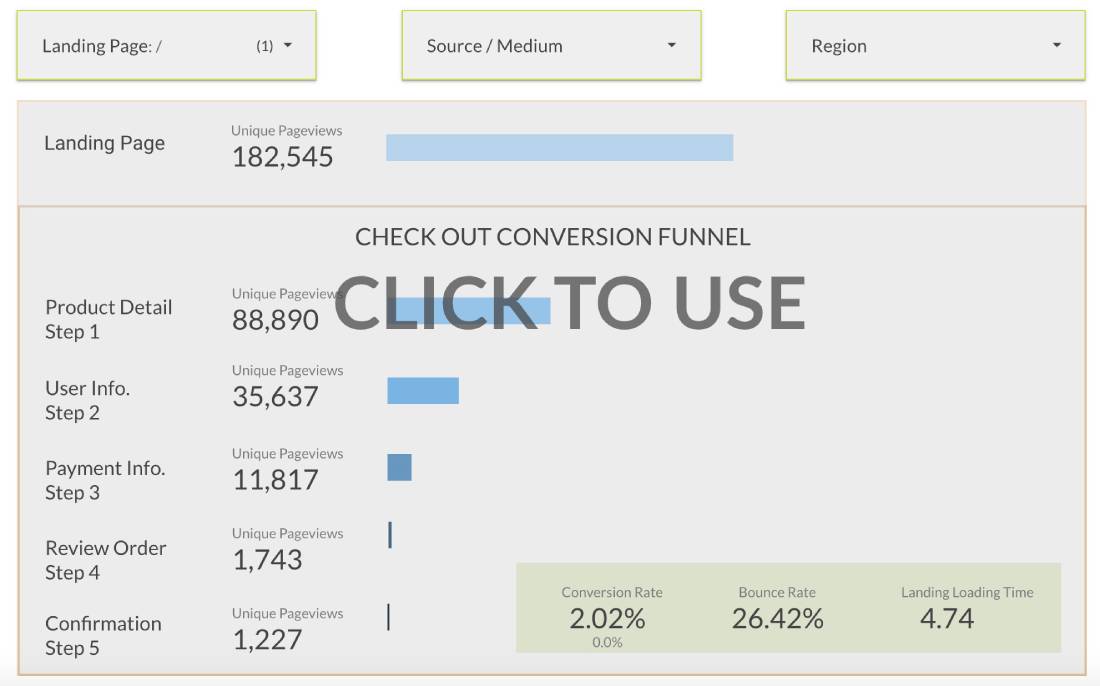
The second dashboard provides insights into landing page performance based on digital channel grouping (medium/source) and device type. This offers more granular information compared to what is displayed in Google Analytics, as it showcases digital channel performance throughout the entire conversion funnel.
Here are some questions we could ask:
- Are we bringing the right traffic to each landing page?
- Is the landing page well-optimized based on content and performance?
- Are users returning to the landing page from the booking engine (check out steps)?
We can also utilize optimization and testing tools for landing pages, considering that they typically follow a standard layout structure for all product pages.
Please note that the following example is not interactive to protect the company’s brand anonymously.
Campaigns Customer Journey Optimization
*The following example is not interactive to anonymously protect the company’s brand.
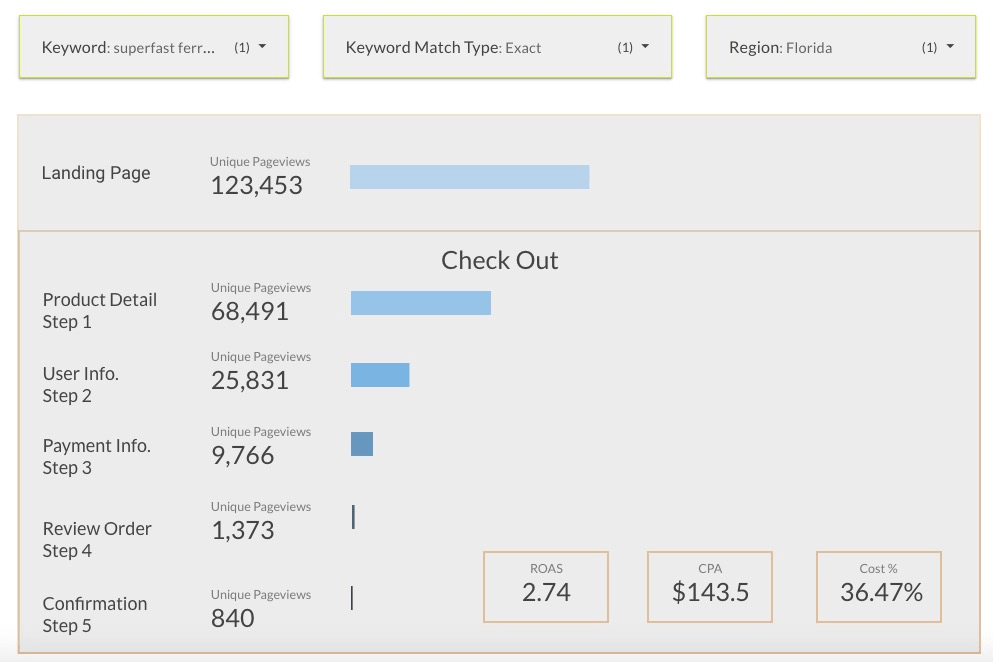
In digital marketing, it is crucial to design, evaluate, and improve all stages of the customer journey, from the top of the conversion funnel to the confirmation page. By isolating specific audiences, campaigns, or keywords, we can analyze their behavior throughout the entire customer journey. This approach can yield several benefits, including:
- Re-assign audience to the right content.
- Improve brand customer experience.
- Reinforce content quality.
- Increased campaign quality score.
- Improve Conversion Rate, etc./li>
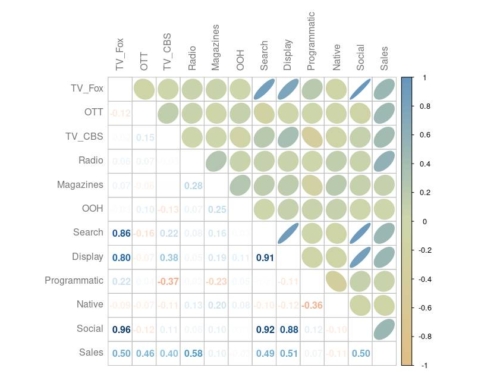
When building dashboards, we have the freedom to be creative by incorporating maps, tables, projections, and other elements. The more we understand the business, the better questions we can formulate, and the more efficient dashboards we can design.